A very common problem that people run into is calculating percentile of a given value in Power BI. Here, I am not talking about what is 80th percentile in the given set of numbers, but actually the opposite, what is the percentile of a particular value in the given set of numbers?
To achieve the former we have straight forward DAX functions – PERCENTILEX.EXE and PERCENTILE.INC but there is no inbuilt function for the latter.
Let’s get to work!
Video Person?
Consider this Data and a simple Pivot Table
I am using this single data of Employee Salaries in different occupation groups.
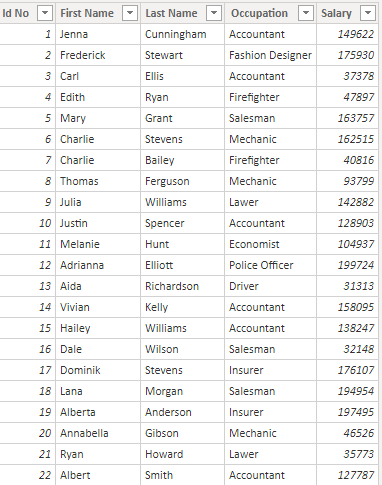
And here is quick Pivot Table displaying Salary for each Emp in the Occupation Group. Salary Total is simply the sum of salary column.
Salary Total = SUM ( Data[Salary] )
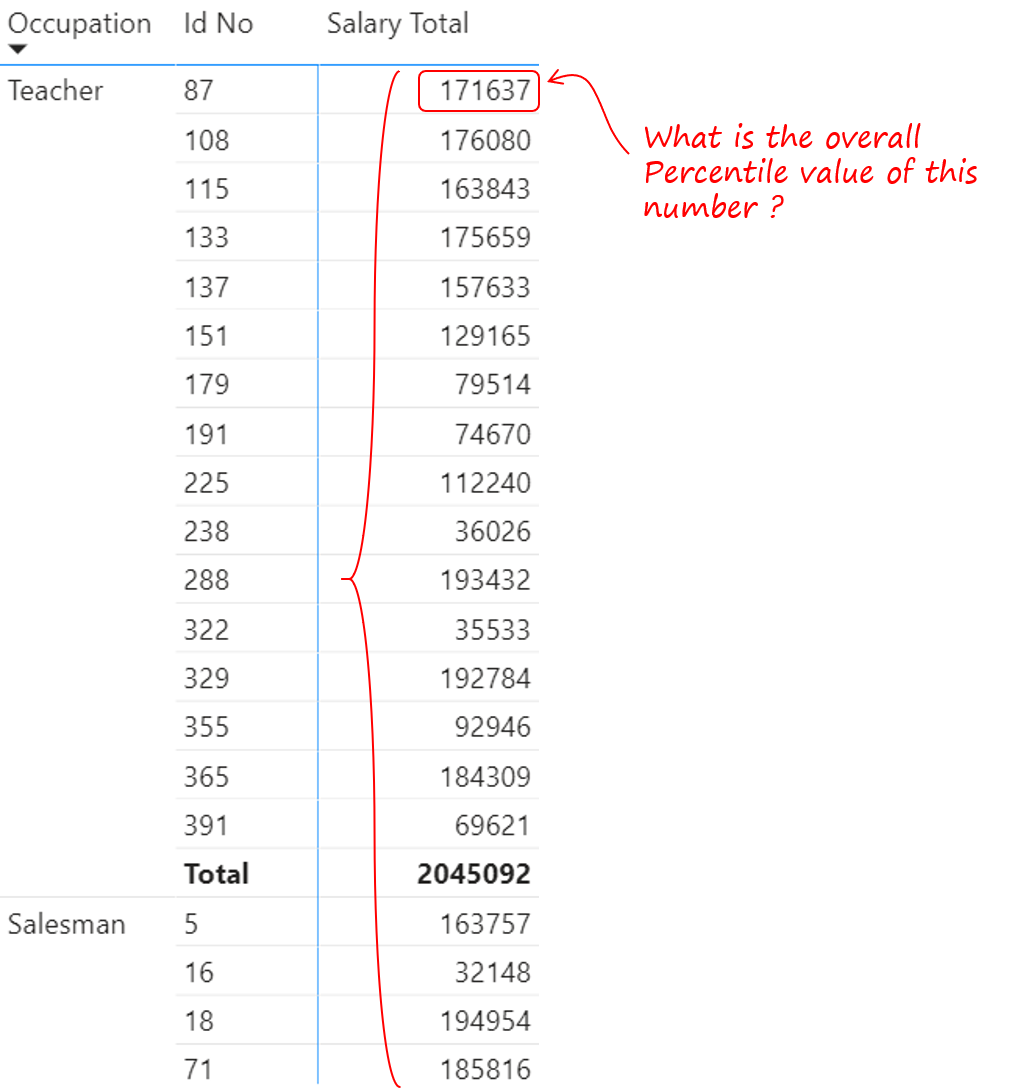
In following Pivot Table, consider this question – What is percentile value for Id No – 87 within the Teacher occupation group?
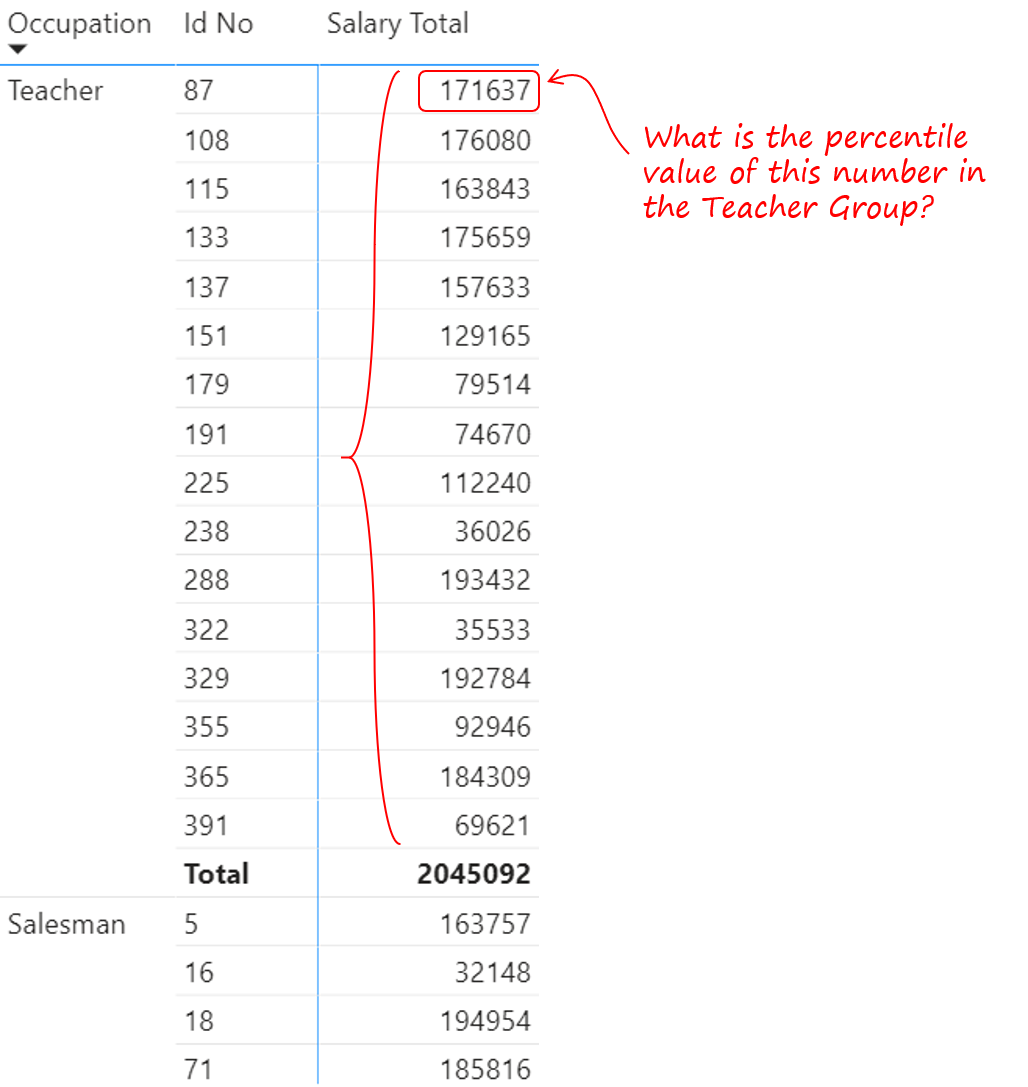
This simple math problem can be solved by this equation.
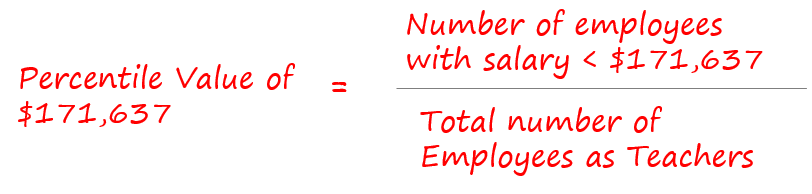
Note – Both the numerator & denominator count is within the occupation group and not on the overall data.
Calculating Percentile for a Value in a Sub-Group
Consider this measure
Occupation Percentile =
VAR TotalSal =
    [Salary Total]
RETURN
    IF(
        HASONEVALUE(Data[Id No]),
        COALESCE(
            DIVIDE(
                --Numerator (below) counts values that are < the EMP's salary in the Occupation Group
                CALCULATE(
                    COUNTROWS(Data),
                    FILTER(
                        ALLEXCEPT(Data,Data[Occupation]),
                        Data[Salary] < TotalSal
                    )
                ),
                --Denominator (below) counts the total employees in the Occupation segment
                CALCULATE(
                    COUNTROWS(Data),
                    ALLEXCEPT(Data,Data[Occupation])
                )
            ),
            0
        )
    )
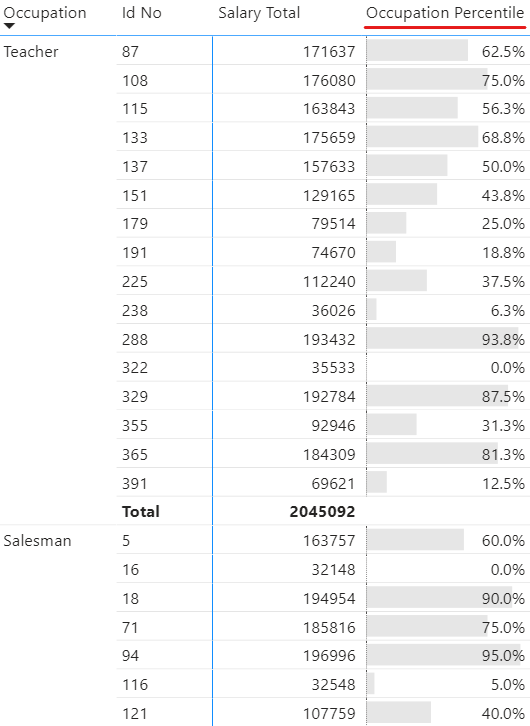
The easy way to understand this Measure is to focus on the two inputs of the DIVIDE function.
- Numerator – counts the salary values less than the salary of each employee in the occupation group.
- Denominator – counts the number of employees in the occupation group.
- The rest of the formula is the extra jazz to make it work only against each employee id and not against the total.
Check out the results
A greedy boss will also ask for the Percentile Rank in each occupation subgroup and before he asks, let’s knock that off too. Consider this really simple ranking measure..
Occupation Percentile Rank =
IF(
    HASONEVALUE(Data[Id No]),
    RANKX(
        ALLEXCEPT(Data,Data[Occupation]),
        [Occupation Percentile],,
        DESC,
        Dense
    )
)
The results seem good 😎
![]()
Calculating Overall Percentiles
Another question could be – What is the percentile value of the Teacher ID 87 in the overall employee data?
In this problem the numerator and denominator change slightly and consider the overall data and NOT one occupation group. Consider this measure..
Overall Percentile =
VAR SalaryValue =
    [Salary Total]
RETURN
    IF(
        HASONEVALUE(Data[Id No]),
        COALESCE(
            DIVIDE(
                --Numerator (below) counts values that are < the EMP's salary amongst all employees
                CALCULATE(
                    COUNTROWS(Data),
                    FILTER(
                        ALL(Data),
                        Data[Salary] < SalaryValue
                    )
                ),
                --Denominator (below) counts the total employees
                CALCULATE(
                    COUNTROWS(Data),
                    ALL(Data)
                )
            ),
            0
        )
    )
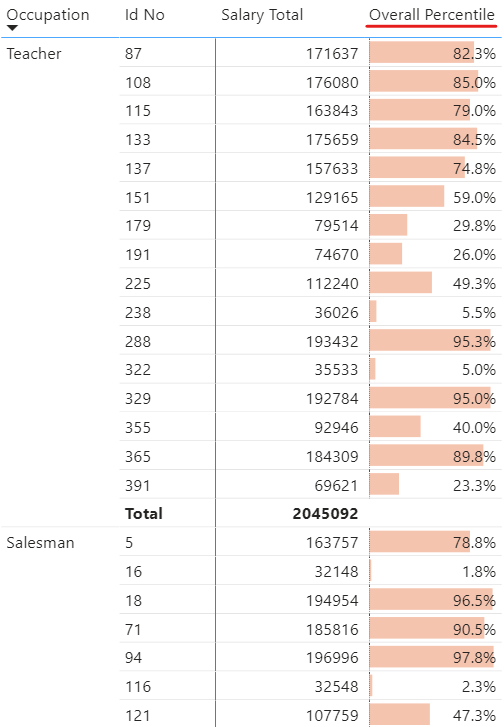
The only change in the formula is the ALL function instead of ALLEXCEPT, in simple words consider the entire data instead of a particular occupation subgroup. The results are good!
And let’s just roll out an Overall Percentile Rank Measure too..
Overall Percentile Rank =
IF(
    HASONEVALUE(Data[Id No]),
    RANKX(
        ALL(Data),
        [Overall Percentile],,
        DESC,
        Dense
    )
)
Just like Overall Percentile Measure I use the ALL function to rank values in the entire EMP Data.
Results..
![]()
If you come looking for a different scenario than this one, let me know in the comments, I’d be glad to help.
More with DAX & Power BI
- Budget v/s Actual Calculations in Power BI
- Slab Based Calculations in Power BI
- Fiscal Year Calculations in Power BI
- Change Measures using a Slicer
- Calculate SAMEPERIODLASTYEAR only for a Partial Period
- Top Selling Product Analysis
- Least Selling Product Analysis