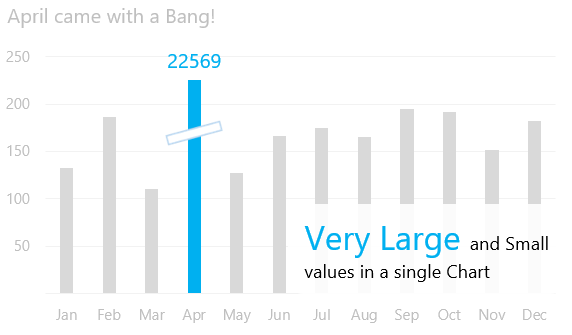
For the first post of 2018, I wish you may have a ton of extreme positive outliers in your life!
Speaking of outliers, one of the very common problem is dealing with charts with very large and small values
Let me share my little hack with you!
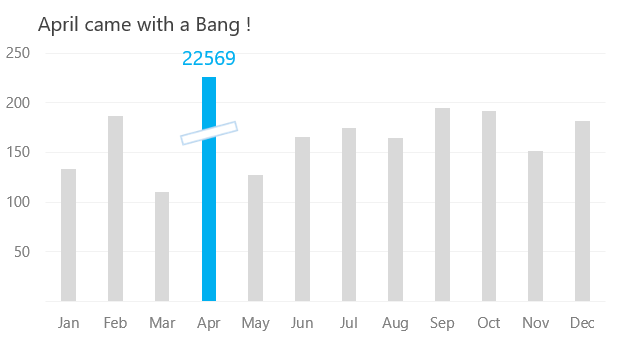
Consider this data!
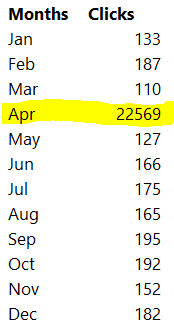
Some unusual (good) happened in April. But it is not good for a Chart!
Let’s Make a few Dummies
A few things to note here
- The reason why we are making dummies is because it will separate out the regular (small) values from the outliers (large values)
- The benchmark is set as 1000 to decide whether the value is small or large
- Rest is a simple IF formula, I am sure you know how to write an IF
Now let’s make a Chart (with dummies)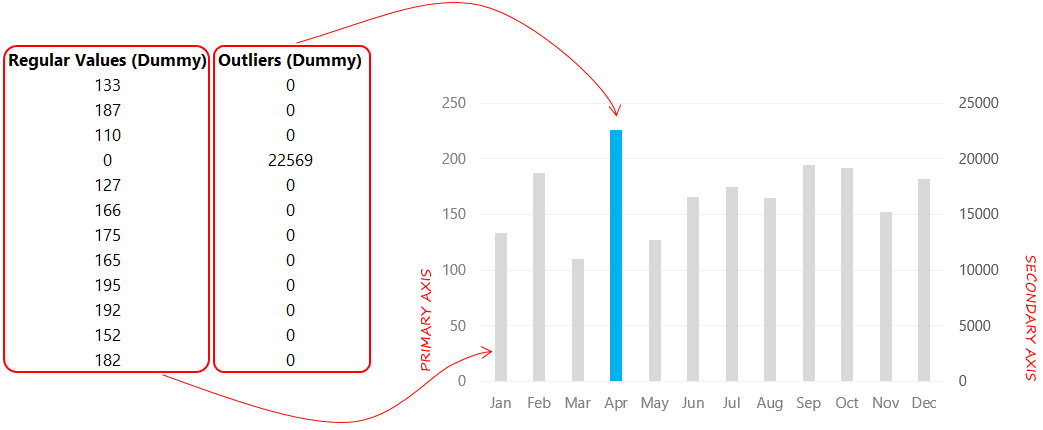
Add the 2 dummies to the chart
- Small / Regular values to go on the primary axis
- Large / Outliers to go on the secondary axis
- Also notice the colors. Outliers are standing out (contrasting blue) and regular values are subdued (grey)
This is good but..
Let’s get that Kink (adding a new dummy)
What are we trying to do here ?
- Kink is nothing but explicitly letting the user know that the chart is broken
- Two more things to note carefully
- I am adding a kink at 75% of the outlier’s value (you can customize it)
- Instead of using a 0 (zero) I have used NA()
Now let me show you how to put this dummy to work
Add the Kink (dummy) to the Chart
Here are the steps
- First add the Kink Dummy to the chart (Ctrl+C to copy the data then select the chart and Ctrl+V)
- The dummy should be on the secondary axis with chart type as ‘Line with Markers’
- Now change the marker type to a rectangle (created using shapes). Simply Ctrl+C on the rectangle then select the marker and Ctrl+V
- Kink added… done!
A bit more finishing & the final chart looks like this..
Here is another similar article from Chandoo
DOWNLOAD THE FINISHED CHART FROM BELOW
Other Clicky (Interesting Charting) Stuff
- Charting Hacks – for working a lot faster with Charts
- Customizing Line Chart Markers
- Dynamic Pie Chart
- Inforgraphic Chart – Type 1, Type 2
- Target Charts – the best ever!