A quick note..
I wish everyone to be safe during these tough times. Here are few things I have been following at home.. might help you too!
- I am trying best not to be affected by COVID19 (by avidly following social distancing practices) but also, more importantly not to be depressed.
- I toggle my days between creating new blogs content / videos and notching up my skills further. The home chores can’t be left alone and about 30 mins of daily exercise.
- I often tell my self – this thing might take time but it’ll pass, be calm!
Dashboard Tour
Coming back to where I can make my word count!
A few days ago I made a dashboard for tracking Corona Cases all over the World. The numbers on the world level were mind boggling even then.
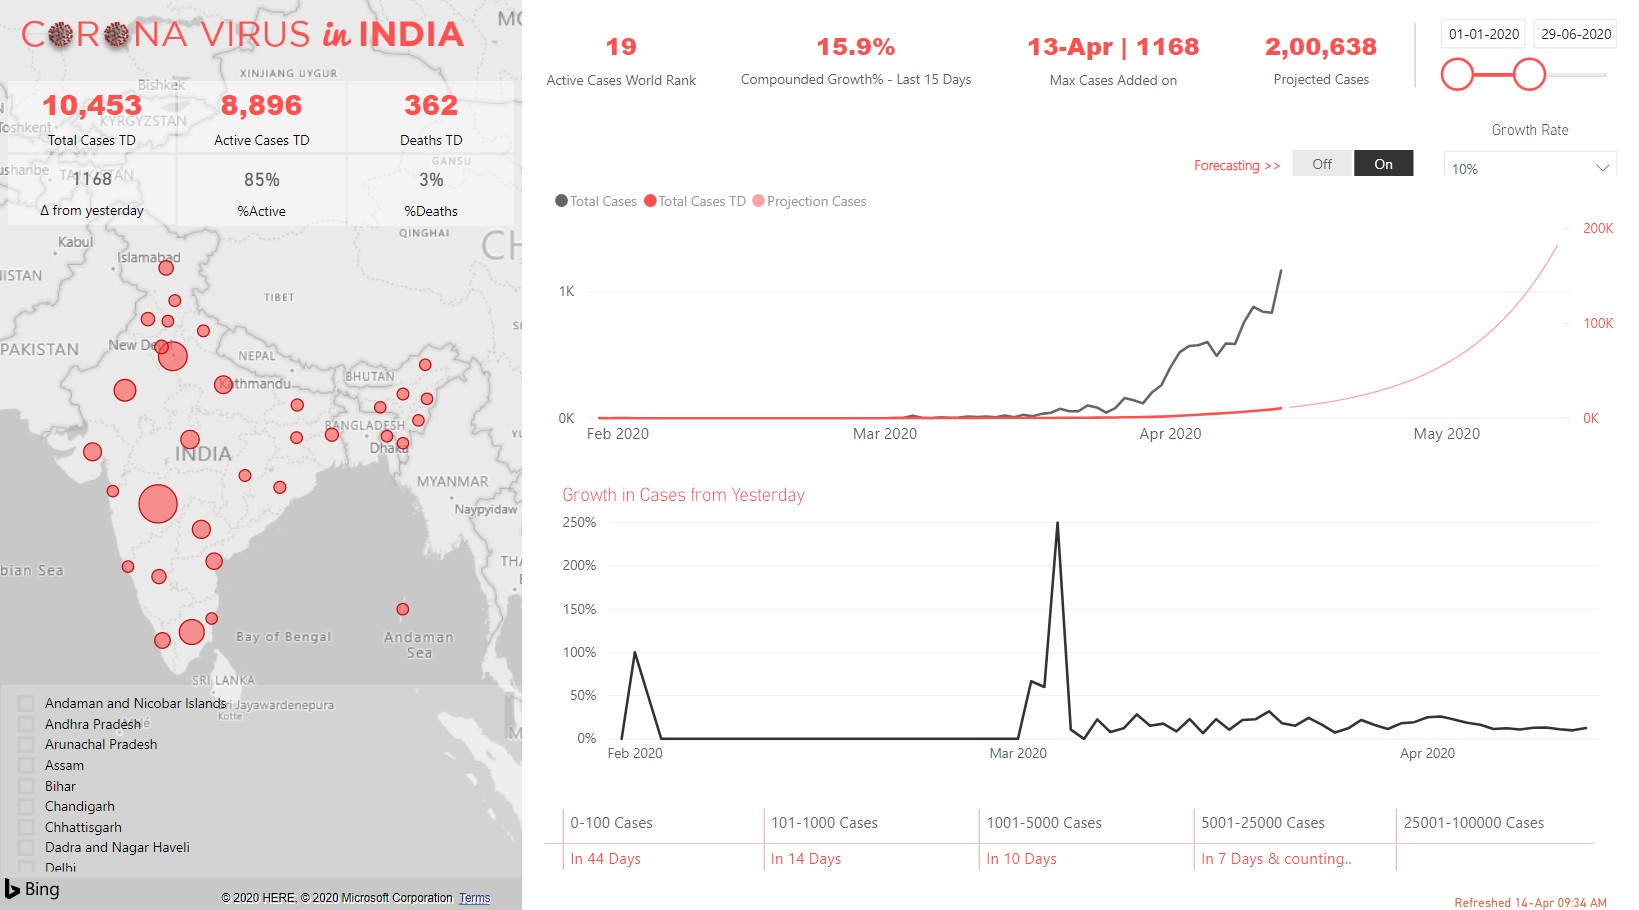
This time, I churned numbers for COVID-19 situation in India and created this Daily State Wise Dashboard. Although the Dashboard may look pretty but the numbers look quite scary. Each time the death count refreshes, it’s a real person who just passed away!
Model and its’ key features
The model is pretty straight single screen analysis of the Data. Along with the standard metrics (like total cases, active and deaths and a few percentages) I have built three interesting features in the model.
- Ability to Forecast Corona Cases – The user can project using a custom growth rate or based on last 15 days compounded growth rate. The projection is restricted to a maximum of 30 days ahead. This is where it get’s really really scary, if you din’t know the power of compounding, you’ll witness it here.
- Distribution of Days in Case Intervals – The table is quite simple to read and shows you the number of days it took to reach.. let’s say 5x cases or 10x cases. The range of the table can be extended
- Max Increase in a State from Yesterday – The black dot on the map shows the state in which max increase in cases has happened since yesterday.
Data used
This is one place I have slogged the most. I searched a lot to find legit data sources to work on, but most sources had some or the other issue.
- The MOH (Ministry of Health) publishes daily data but the problem being that this data is always as on today. I even wrote a small VBA code to copy and paste data from the site everyday, but I couldn’t get my hands on historical data so I skipped this.
- Next I found some data on Kaggle where it seemed that I found a gold mine of patient level data. But at the second sight the numbers seemed so off that I dumped it.
- Finally I used this data on GrainMart, collected and maintained by a friend (who runs the site). I believe he is directly feeding it from the State Government Websites and other legit sources. It also seems in line with the Data on Worldometers
So that’s a little struggle story behind getting the data. I still want you to consider the data with caution, since I cannot take any responsibility of it. My motive of this dashboard is only to show the Power of Power BI than to implicate anything from the data.
Model Download, updates and refreshes!
- As and when new sources emerge, I may update the model with new calculations and visuals.
- I’ll be refreshing the model at least once a day. You can either re-download the new model or play with the live link.
- Scroll down to the end of this blog to download the model.
More Power BI Dashboards
- Corona Virus World Dashboard
- Paytm Dashboard
- Learning and Development Dashboard
- Recruitment Dashboard
- Invoice and Payment Management Template
Your word..
In the comments, let me know if you have any suggestions about the dashboard and how did you find it ?
Be safe! This too shall pass