COUNTIF is such a commonly used function in Excel that everyone who makes a transition to using Power BI often stumbles on this question – “How can I do a COUNTIF in Power BI ?”
Power BI is very unlike Excel, you don’t have cells where you can type the COUNTIF formula, rather almost everything in Power BI works on filter contexts. In this post I’ll be showing you different ways of writing COUNTIF in Power BI using DAX.
Let’s begin people!
In case you are more of a video person and want to grab it before this long piece of post, here it is. Enjoy!
COUNTIF using a Visual (Pivot Table)
Consider this simple “Sales” data with 4 columns. Pretty self-explanatory!
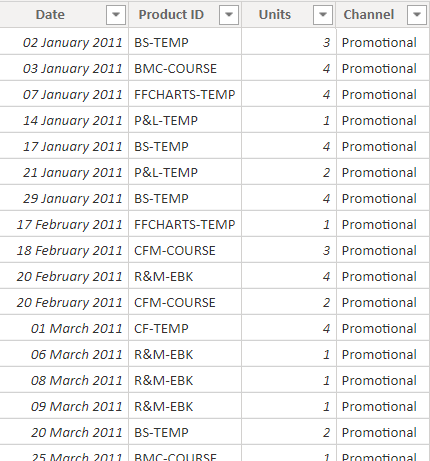
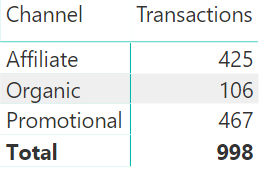
My Question: Count the number of transactions done in each channel.
Possible Answer: This is easy to solve in a Pivot Table, so is it in Power BI. In Power BI,
- Create a Matrix Visual (which is the Pivot Table for Power BI)
- Drag Channel from Sales Table in Rows
- Drag any other column (let’s say Date Field) in Values, change the calculation to COUNT & rename the field and you are done with your COUNTIF
This is pretty standard stuff, everyone knowing Pivot would know of it. Before we move on, let me tell you that dragging a column the values section of the pivot table is “looked down” upon in Power BI.. Simple reason – columns are expensive! It’s a good habit to explicitly create measures for even the simplest calculation. Now let’s move ahead..
COUNTIF using a Measure
Like a said, measures are a good habit. Let’s create two measures that will work the same
Transaction Count Measure 1 = COUNTA(Sales[Date])

Transaction Count Measure 2 = COUNTROWS(Sales)
In this scenario both the measures will give the same result. Then how are they different?
- COUNTROWS function simply counts the number of rows in the table
- COUNTA function counts the number of values in the column. The null values (blanks) in the column aren’t counted.
- In this example since none of the values in the Date column are blank so both the measures will deliver the same results
Personally I’d recommend Measure 2 over Measure 1
COUNTIF in the Fact Table
Consider the same Sales table once again.
My Question : For some reason you want to add a column in this table to find the frequency of dates. In other words, how many times does each date appear? Again a COUNTIF!
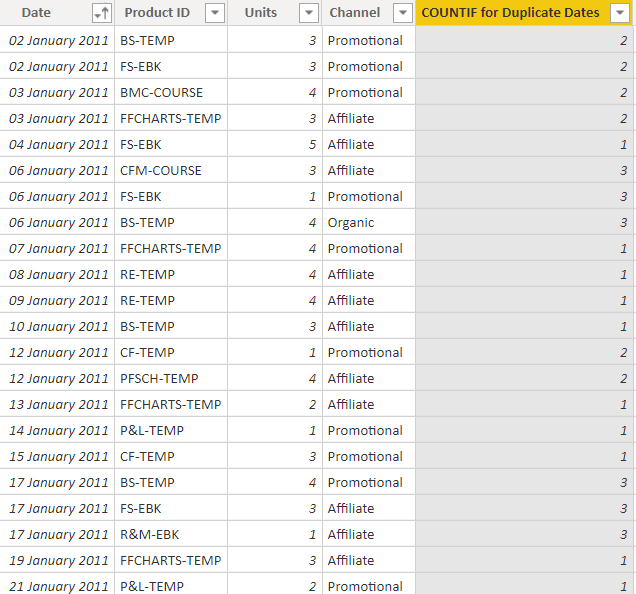
Unfortunately you can’t write =COUNTIF in Power BI, because it doesn’t exist. But that doesn’t mean that you can’t do it. We are going to write a short DAX formula for achieving this. I create a new column in Sales Table with the following code
COUNTIF for Duplicate Dates =
VAR __CurrentRowID = Sales[Date]
RETURN
COUNTROWS(
    FILTER(
        ALL(Sales),
        __CurrentRowID = Sales[Date]
    )
)
See the results.. that’s what we wanted!
Let me explain
- The code begins with a Variable that captures the current row date.
- Then in the FILTER function I expand the full Sales table using ALL and see how many dates are matching with the variable (current row date)
- Finally wrapping that FILTER in COUNTROWS, I am able to take a count of rows that were matching the current row date
- COUTNIF done!
Yeah, I know it’s not that friendly but that’s DAX for you!
if you don’t like using Variables (although you should, but that’s okay!), you can write the same COUNTIF differently.
COUNTIF for Duplicate Dates with Variable =
COUNTROWS(
    FILTER(
        ALL(Sales),
        EARLIER(Sales[Date]) = Sales[Date]
    )
)
The above code will return the same result
An additional layer of complexity could be if you would like to do a COUNTIF but with 2 conditions, that’s what we call a COUNTIFS in Excel
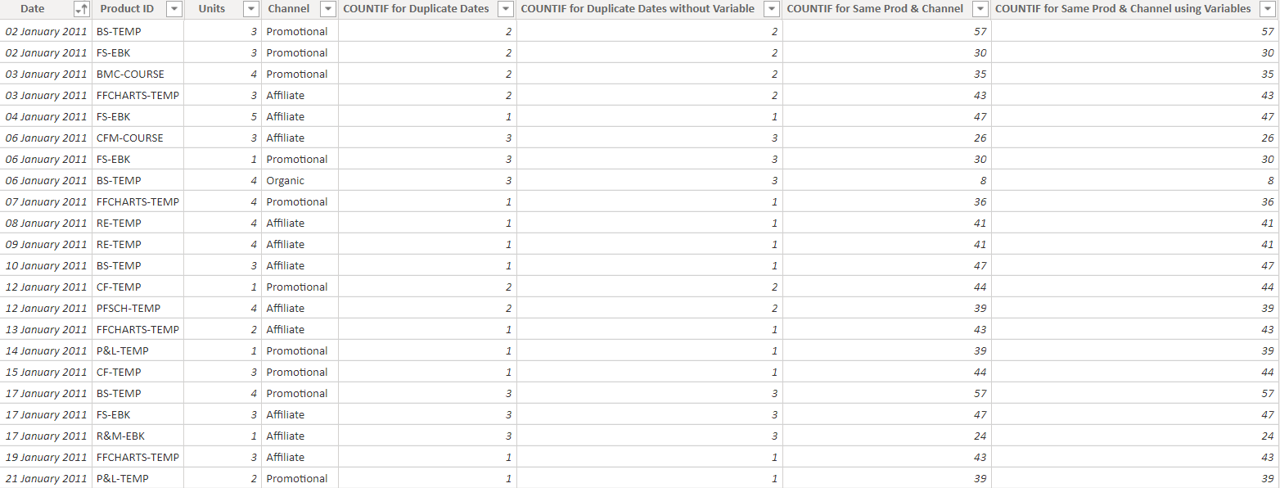
Another Question: How many rows have the same Product ID and Channel?
We apply the same logic as above the only difference being that we add 2 conditions using the && operator, take a look
COUNTIF for Same Prod & Channel =
COUNTROWS(
    FILTER(
        ALL(Sales),
        Sales[Product ID]=EARLIER(Sales[Product ID]) &&
        Sales[Channel] = EARLIER(Sales[Channel])
    )
)
The same code could be written using variables as well
COUNTIF for Same Prod & Channel using Variables =
VAR __CurrProd = Sales[Product ID]
VAR __CurrChannel = Sales[Channel]
RETURN
COUNTROWS(
    FILTER(
        ALL(Sales),
        Sales[Product ID]=__CurrProd &&
        Sales[Channel] = __CurrChannel
    )
)
Here are the results
COUNTIF in the Lookup Table
Another thing that a lot of people try to do is try writing a COUNTIF in Lookup Table. Let’s say we have another table, Products, linked to our Sales Table using the common column as Product ID / Code
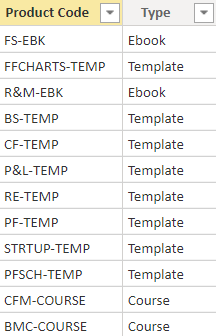
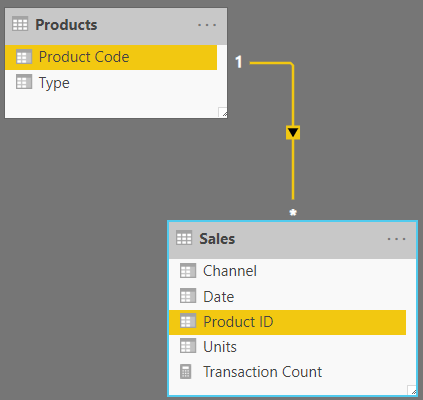
Here is how the relationship is set up
My yet another Question: Create a column in the Products Table to find the number of products sold in the Sales Table?
Since we have a relationship between both tables, this be easily solved using RELATEDTABLE Function
A Quick Note: RELATEDTABLE function is mostly used in Lookup Table (in our case Products) as compared to RELATED function which is mostly used in Fact Table (in our case Sales)
Here is the DAX Code
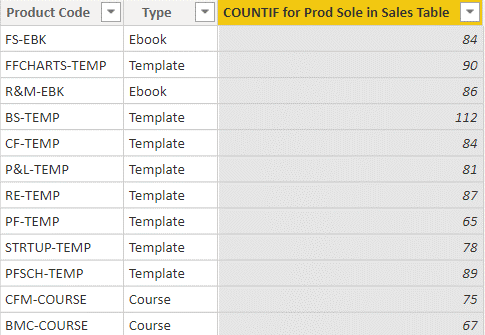
COUNTIF for Prod Sold in Sales Table =
COUNTROWS(RELATEDTABLE(Sales))
- The RELATEDTABLE function returns a Table with matching rows (as per the relationship) from the Sales table
- I wrap that in the COUNTROWS function to take its count.
- Again COUNTIF done!
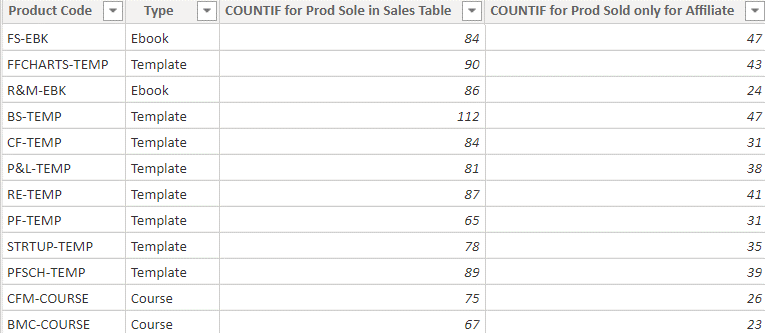
Another tricky question could be to Create a column (in Products table) to find the matching Product IDs that sold under Affiliate Channel? This is our classic COUNTIFS yet again but this time in the Lookup Table
Not to worry, all I do is add a condition along with our existing RELATEDTABLE function
COUNTIF for Prod Sold only for Affiliate =
COUNTROWS(
    FILTER(
        RELATEDTABLE(Sales),
        Sales[Channel] = "Affiliate"
    )
)
- The FITLER function filters out only those rows which belong to “Affiliate” Channel
- COUNTROWS function take the count of those rows
- COUNTIF done!
Results..
Is there any other type of COUNTIF that you are trying to do which I have not spoken about? Please let me know in the comments. I’ll be glad to help
Recommendations
Ideally speaking you should be creating measures rather than creating columns in your tables. But for some reason if you do want to create columns for testing or some odd calculations, I hope this helped
Cheers!
– – – – –
Update on 13 Dec 2019
Running COUNTIF like Excel using DAX
Another common problem is getting running count in DAX, in simple terms how many times has the current item appeared until the current row. You’d do something like this in Excel =COUNTIF(A$1:A1,A1)
Let’s see how can we do this in Power BI, assume this data!
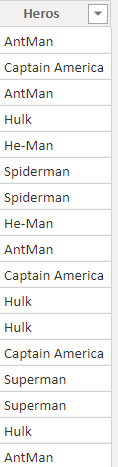
yeah.. superheros!
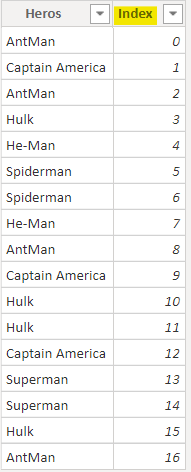
To be able to do this we’ll need an Index column (serial numbers). Easy enough
- In the Query Editor >> Add Columns Tab
- Index Column >> Starting with 0
the result looks like this!
Here comes a DAX code for a Calculated Column
Running Count =
COUNTROWS(
    FILTER(
        ALL(Data),
        Data[Index] <= EARLIER(Data[Index]) &&
        Data[Heros] = EARLIER(Data[Heros])
    )
)
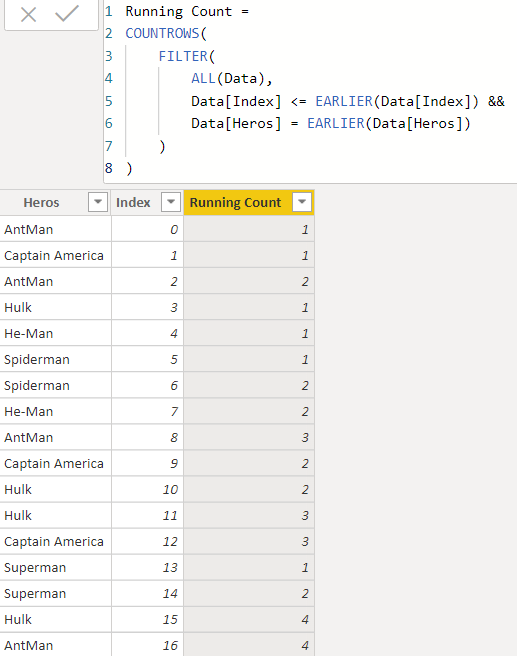
Take a look at Superman or Spiderman (or any other man) the count is 1 at the first instance and increments each time the “man” re-appears!
Explaining the Formula
- ALL function removes the filter from Data table
- Then checking for 2 conditions
- Index should be lesser or equal to the current row Index number AND
- Hero should be equal to current row Hero
- Wrap this in COUNTROWS and this gives us the count till the current row
Done!

More DAX and Power BI Stuff..
- TOP Product Analysis using DAX
- DAX Keyboard Shortcuts
- Actual versus Budget Calculations in Power BI
- How to correctly use IF in DAX
- Use Icons to create KPIs in Power BI
- Change Pivot Table Field Calculations with a Slicer
- Financial Year Calculations in Power BI
Learn DAX from Scratch !!!
A comprehensive course to learn DAX step by step and solve real time problems in Power BI.
DOWNLOAD THE COURSE OUTLINE | ENROLL IN THE COURSE