The FILTER function is used to filter a table based on certain condition(s) and is somewhat similar to Filtering Data in MS- Excel. Let’s explore the intricacies of the DAX FILTER function.
DAX Filter Function Video
Take a look at this video to get a better hold of the topic.
DAX FILTER Function Syntax
This function accepts two arguments
- Table
- Condition
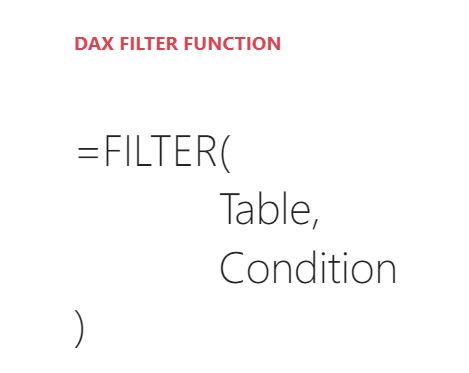
- The first argument, i.e., Table, accepts a physical or a virtual table to Filter.
- A physical table can be seen in the data model.
- A virtual table is the one created on the fly.
- The second argument, i.e. Condition accepts a logical test that is performed in each row of the table.
- All rows that satisfy the condition, i.e. return TRUE are kept while other rows are removed.
- Keep in mind the condition must return a True or False output else it stands invalid.
Important – The output of the FILTER function is a table containing the rows that satisfied the condition.
DAX FILTER Function in Action
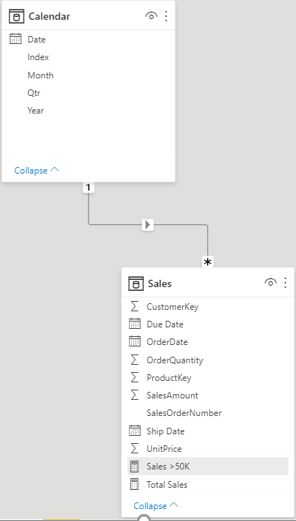
Let's run the FILTER Function on this data model with Sales and a standard Calendar Table linked with a one to many relationship.
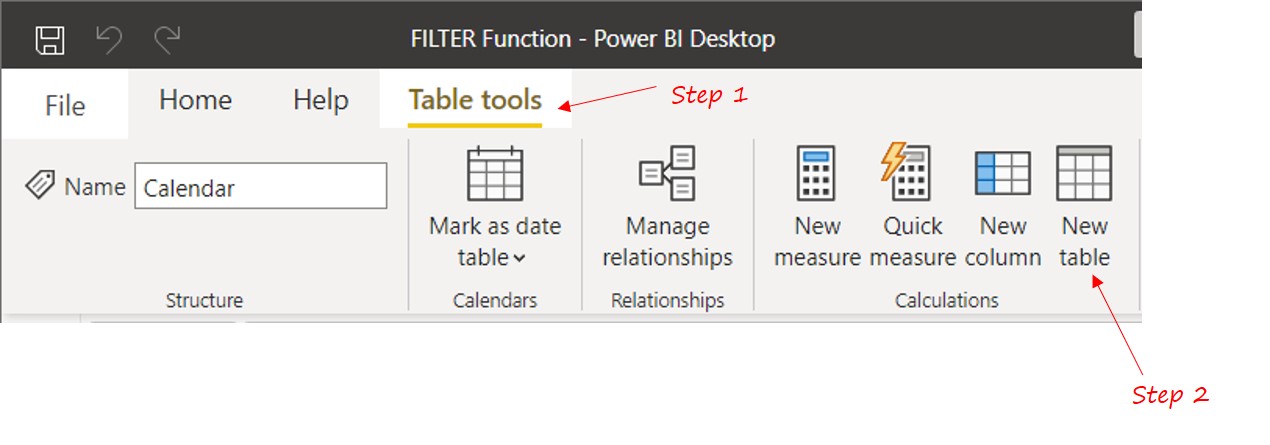
Because the FILTER Function returns a Table, let’s create a Table. Go to Table Tools >> New Table.
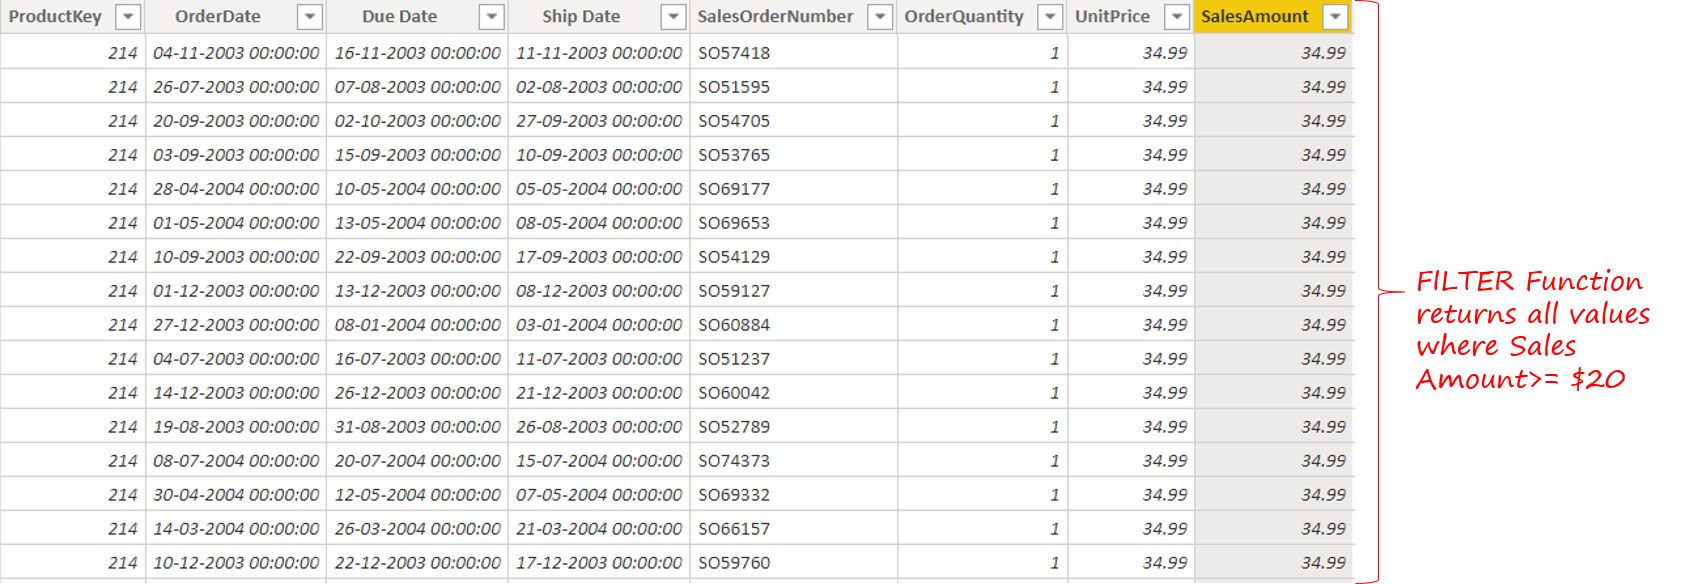
Let’s create a simple table with a condition on the Sales Amount column >= $20. Consider the following DAX Code.
Dummy Table =
FILTER (
    Sales, -- This is the Table
    Sales[SalesAmount] >= 20 -- A condition for each row, returns TRUE / FALSE output
)
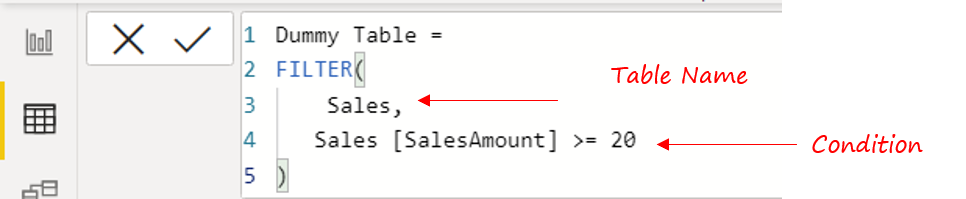
- Input 1 Table – The Sales table is filtered
- Input 2 Condition – Check if each row is >= $20. Note the condition will return either a TRUE or FALSE for each row of the Sales Table.
- Output Table – You’ll get a table with rows that matched the condition.
FILTER Function used on a Virtual Table
Sales was a physical table present in the Data Model, let’s see if we can apply the FILTER function to a table that doesn’t physically exist i.e. a Virtual Table.
Let’s solve this Question – Get a table of dates where the sales amount is >= $50000. Consider this DAX for creating a Table.
Dummy Table 2 =
   FILTER ( VALUES ( Sales[OrderDate] ), -- VALUES creates a single columnar table with unique dates.
   [Total Sales] >= 50000 -- For each date (row) check if Total Sales >= 50000
)
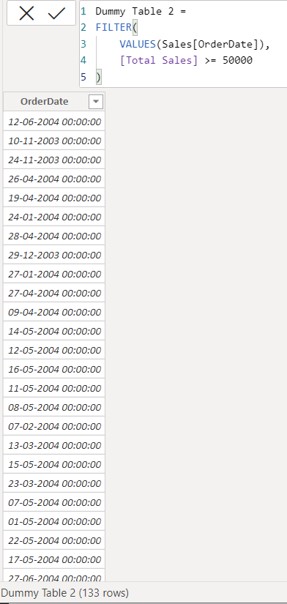
- Input 1 Table – The VALUES Function creates a one columnar table with unique Dates.
- Input 2 Condition – Check if Total Sales Value for each date is >= $50,000. Again, the condition will return either a TRUE or FALSE for each row of the Virtual Table.
- Output Table – You’ll again get a table with rows that matched the condition.
The output contains 133 rows, i.e. there were 133 days when the sales were more than $50,000.
FILTER Function used in a Measure
Question – Find the Total Sales Amount for High Selling Days. A High Selling Day will have Sales >= $50,000. Let’s build on this from the previous example. Consider a new measure with the same DAX Code used earlier for creating a virtual table.
Sales >50k=
FILTER (
    VALUES ( Sales[OrderDate] ), -- The VALUES function creates a Virtual Table.
    [Total Sales] >= 50000 -- This condition is tested for each row of the Virtual Table
)
The Problem – If you drag this measure to a visual / a Pivot Table, this will throw an error.
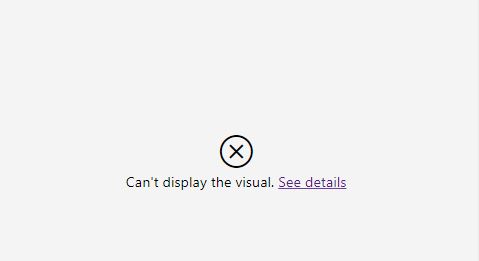
The Reason – Since the FILTER Function delivers a table, a table cannot be summarized as a single value / scalar output.
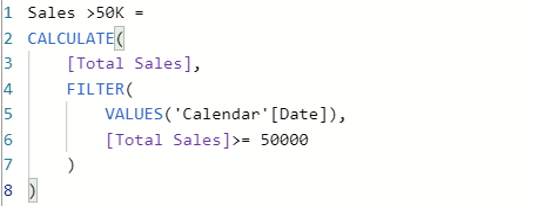
The Solution – We need to SUM the values of the table to get this right. Consider the revised DAX Measure.
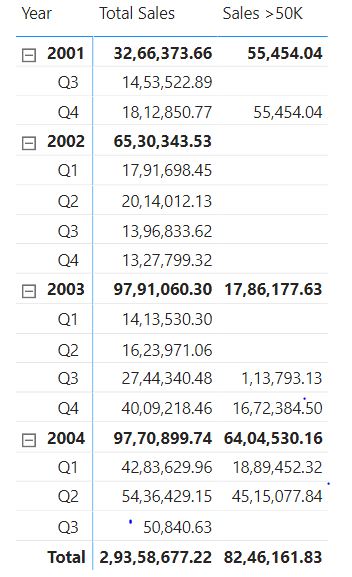
Sales >50K =
CALCULATE (
    [Total Sales],
    FILTER (
        VALUES ( 'Calendar'[Date] ),
        [Total Sales] >= 50000
    )
)
The CALCULATE function outside aggregates (sums) the sales value for the rows returned by the FILTER Function.
The output obtained would be as follows
DAX FILTER Function – A Quick Summary
- FILTER function has two parts, a table and a condition.
- The Table can be Physical or Virtual.
- The condition must be return a TRUE / FALSE.
- The condition is checked for each row of the table and the row with TRUE output are kept.
- The output of the function is a table.
- If you are using the FILTER function in a measure, you need to aggregate the table to return a scalar value.
More on DAX Functions
- The EARLIER Function
- The CALCULATE Function
- The ALLSELECTED Function
- A few tricks with the FORMAT Function
- Check out my DAX Function Playlist