Charts and PowerPoint Presentations are like two friends which are seen together in boardrooms around the world. Wouldn’t you like to know the sanctity of keeping them together in multiple ways 😀
Method 1 ) Simple Copy and Paste.. No-Brainer !
When you make a Chart in Excel, you can simply copy (Ctrl + C) them and Paste (Ctrl + V) into your PowerPoint slide
Pros:
- This is by far the quickest method I have come across
- Chart formatting Tabs (Design, Layout and Format) appear in PowerPoint ribbon for any of your formatting needs
Cons:
- At times even when you have saved you backup excel sheet containing charts, it would abruptly break the link with the slides. Edit Data option would just not work!
Method 2 ) Linked Picture
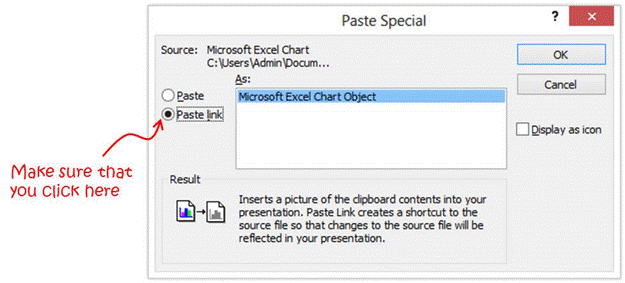
You can insert the chart as a linked picture to your excel spreadsheet. To do that, simply copy the Chart (Ctrl + C) and use paste special (ALT E S) to paste the chart. Make sure to choose the Paste Link option and Excel Chart Object
Pros:
- PowerPoint inserts Charts as linked picture to your excel file, so what ever changes you make to your Charts(in excel), your chart pictures in the slide get updated
- Sometimes Charts are a bit easier to manage when pasted as pictures, because they are unified as a picture object
- The link to the excel file does not break until you change the file name or the location
Cons:
- Any changes in charts need to come via your excel file , no changes can be made in PowerPoint since your charts are now pictures.. damn.. I know, It can be a pain at times
- The more charts you link as a picture, PowerPoint tends to become slow and asks you to update the links each time you open the presentation
- Picture quality of charts seem to be sub standard as compared to actual charts pasted
Method 3 ) Insert as an Object
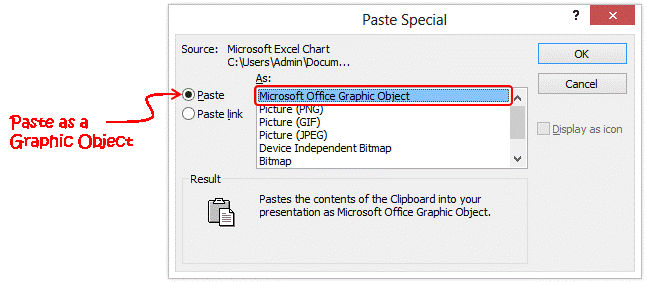
This one seems to me the most robust method for inserting charts. Simply copy the chart and paste special as an Object
Pros:
- The Chart (Object) comes intact with all the chart tabs available in PowerPoint for any formatting changes
- Chart visual quality is high
- Edit data (in right click menu) option takes you to file from where you have a pasted the chart
Cons:
- Sometimes the linked picture option can be confused with this one, not really a con but a caution
- No more cons that I could think of (and I use this option over others 😀 )
Some ever green charting conventions
- Always have a single file/sheet where you make all your charts, so the next day (or next week) you have a unified place to make changes, if required. It immensely helps.. trust me
- Refrain from pasting charts as picture, it really mars the quality of the chart image
- Paste charts as Objects (method 3) it is easy and keeps a robust link to your data
How do you integrate your charts in PowerPoint, do share using comments!