Visualization 1 – Change in Rankings
Visualization 2 – Overall
Recently the Olympics have been the talk of the town! Personally I have been following Olympics for just 2 reasons
- To see the medal count for India
- To be astonished by the performance of US
When the Olympics ended I thought why not make a Dashboard and feed people with analytics of RIO and may be even compare it to London Olympics. Both of these are unlocked, rip them apart and see how did I put them together
Visualization 1 – Shift in Rankings
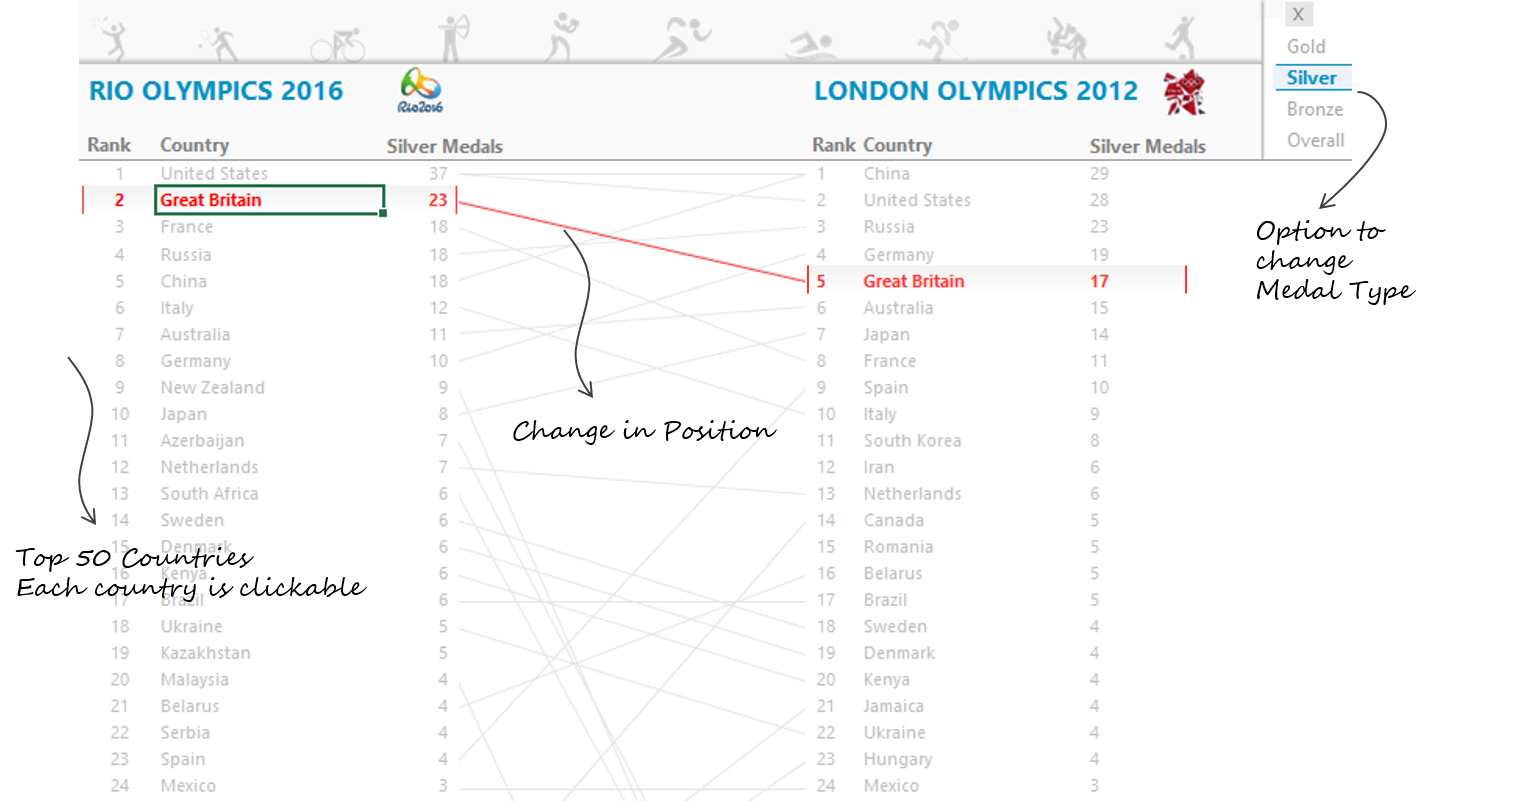
The Inspiration to make this visualization came from here. This was a tough one!! To get my head around this, I took almost 7 hours
Visualization 2 – Overall
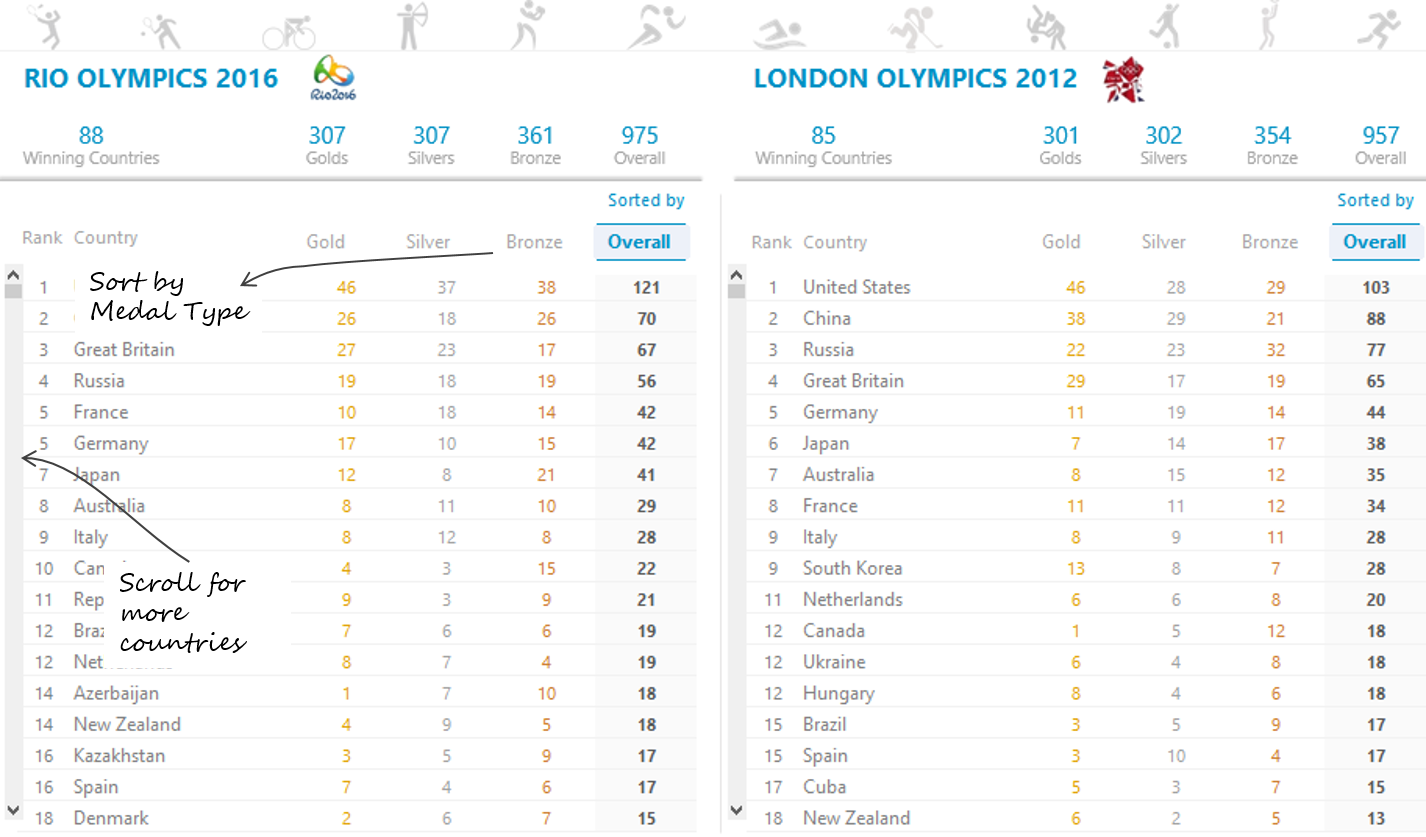
This was not so difficult and I was done with this in about 2 hours.
DOWNLOAD THE DASHBOARD FROM BELOW
- It contains both the visualizations!
- Be sure to enable macros before you start playing with it!
- Works well in Excel 2010 and above!!
Resources and Links
Here are a few things that will help you understand some of the concepts used in making both of the visualizations
- How to make a Scrolling list in Excel
- Beauty Tips for your Excel Dashboard
- How to get Vector Icons
- Dynamic Text Boxes in Excel
- Slicers in Excel
- Slicers Formatting in Excel
Some more kick ass Visualizations/Dashboards
- Cost Structure Visualization – From Chandoo’s Dashboard Contest
- 30 Day Challenge Dashboard
- Indian Republic Day Visualization
- Shift Between the Companies Chart
- Dashboard in 15 Mins