In this blog, you’ll learn how to sum visible values of a table in Power BI. Although this sounds intuitive but it isn’t.
SUM Visible Values – Video
Summing Visible Values
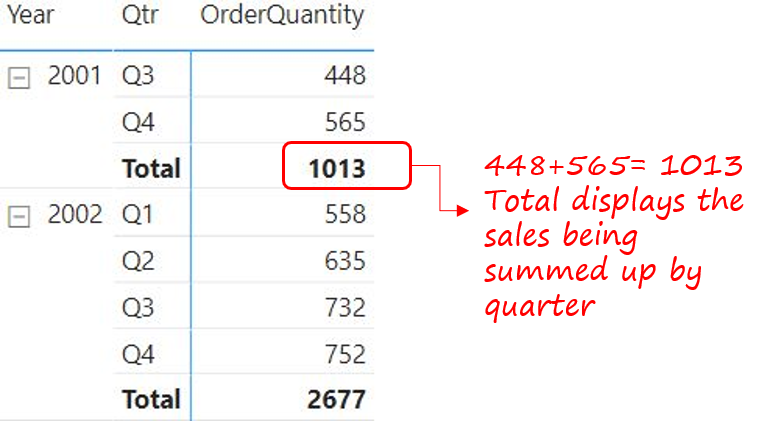
In the visual below the Order Quantity at the total level is correctly summing the values visible for each quarter.
Now, let's create another measure to get a count of the unique products.
Unique Products Sold =
DISTINCTCOUNT ( Sales[ProductKey] )
Dragging this measure to the table, we will get the following output
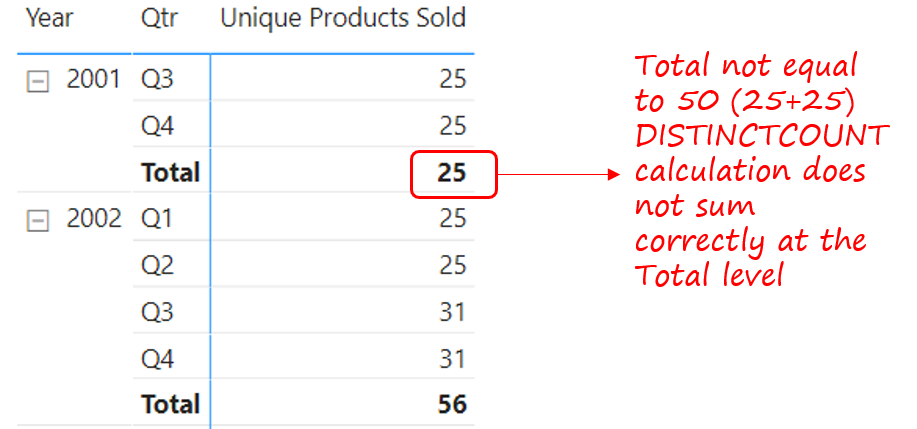
Although the total level numbers are absolutely correct because there could have been overlapping products for each quarter but for the entire year (total level) there are 25 unique products.
But if for some reason if you want to take the SUM of unique products for each quarter rather than distinct count calculation then we need to do this calculation differently.
Summing Visible Products Correctly
I am trying to build a logic where distinct count calculations happens for each quarter but at the year level (total) the summation happens for each quarter and not distinct count.
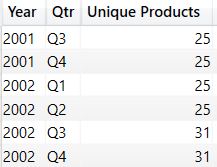
Let’s write a query in DAX studio to produce a table.
EVALUATE
    ADDCOLUMNS (
        SUMMARIZE (
            Sales,
            'Calendar'[Year],
            'Calendar'[Qtr]             ),
        'Unique Products',
            CALCULATE (
                DISTINCTCOUNT ( Sales[ProductKey] )
            )
    )
As can be seen, the above query generates a 3 columnar table (just like our matrix visual). However, the difference here is that we have physically generated a table where we can now use the Unique Products column to SUM the values.
Let’s feed the above table in the SUMX function and revise the measure.
Unique Products Sold =
SUMX (
    ADDCOLUMNS (
        SUMMARIZE (
            Sales,
            'Calendar'[Year],
            'Calendar'[Qtr]
        ),
        'Unique Products',
            CALCULATE (
                DISTINCTCOUNT ( Sales[ProductKey] )
            )
    ),
    [Unique Products] -- to sum up unique products
)
Committing to this formula, I'll get the output as follows:
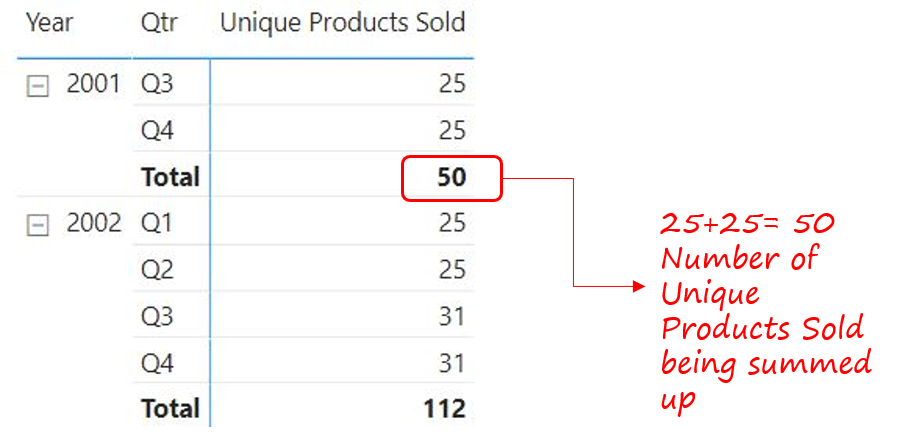
Now, we get the sum of products at the year (total) level.