In this blog, I’ll show how can you display the Sales of Top 'N' products and categorize the rest as “Others”. This is a common need in business reporting, let’s see how can you do this using some DAX & Data Modeling and some visualization tricks.
Display Sales for TOPN & Others – Video
Firstly, let's go ahead and see what our final output looks like.
Before we proceed, let's take a look at the Data Model.
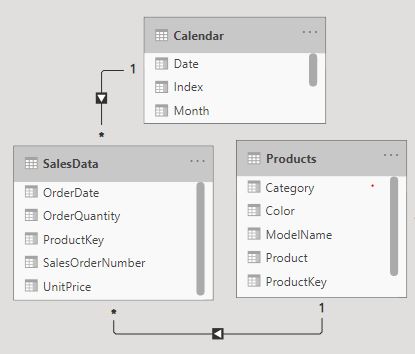
This post is going to be a long one, so let me summarize the building blocks of this visual.
- We need to display Product Names along with 'Others' on the X-Axis.
- We need a Calculation / Measure to group the Sales for Top Products and Others.
- A Slicer to select the number of Top Products displayed in the Visual.
- Conditional Formatting to color the Top Products and Others.
- Sorting of the Visual.
- Dynamic Title that displays the % contribution of Top Products.
#1 Display Product Names and 'Others' as a category on the X-Axis
A general rule – Anything that is displayed on the x-axis of a chart needs to be physically present as a column of a table.
In our scenario we need Product Name and 'Others' on the horizontal axis of the chart, that can only be done if we have a column that has product names and 'Others'.
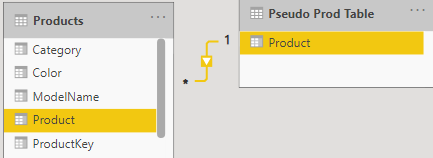
To do this let's create a Pseudo Prod Table:
Pseudo Prod Table =
UNION (
    DISTINCT ( Products[Product] ),    -- to find unique names of the products
    DATATABLE (                        -- one row table having value 'Others'
        'Product', STRING,
        { { 'Others' } }
    )
)
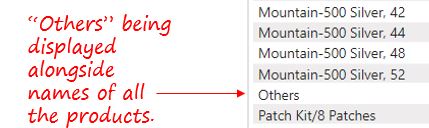
If you create a Matrix Visual using the Products column of the pseudo table you'll see all products and “Others”.
Let's also create a one to many relationship between pseudo products table and products table.
Now that we have displayed Product names along with “Others”, let’s create a calculation that can group the sales of Top Products and the rest as “Others”.
#2 Calculation / Measure to group the Sales for Top Products and Others
Let's start with this simple measure
Top N Sum Sales =
CALCULATE (
    [Total Sales],
    TOPN (                   -- top 3 products by Sales
        'Pseudo Prod Table',
        [Total Sales]
    )
)
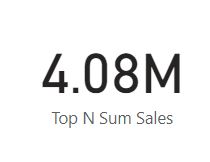
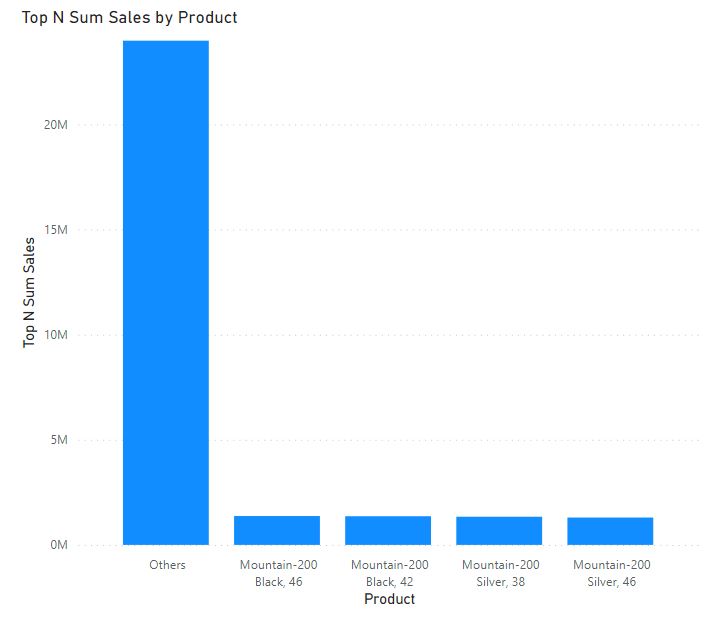
With the above measure I'll be able to see the sales of the TOP 3 Products. For instance refer the card visual
Although this measure won't work if you drag this to the Matrix visual. Problem – At the product level I see the sales of all the products and not just the top 3 products.
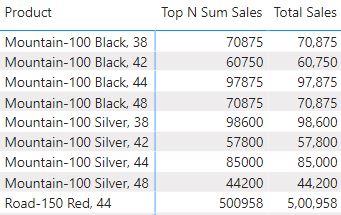
Simple reason, when the sales of each product being compared to itself, it would would obviously rank in the Top 3 products and hence all products are displayed.
To solve this, I can modify my code as follows, so that the only sales of the top 3 products are displayed against their name.
Top N Sum Sales =
CALCULATE (
    [Total Sales],
    KEEPFILTERS (                                  -- will apply the product filter to show only 3 products
        TOPN (
            3,
            ALLSELECTED ( 'Pseudo Prod Table' ),   -- considers all visible products
            [Total Sales]
        )
    )
)
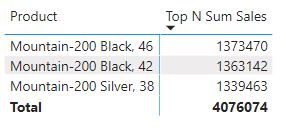
The results look better!
Next if I subtract Sales of top 3 products from Total Sales of all the products we get value to be displayed in the “Others” category.
Let’s further revise the measure.
Top N Sum Sales =
VAR TopProdTable =
    TOPN (
        3,
        ALLSELECTED ( 'Pseudo Prod Table' ),
        [Total Sales]
    )
VAR TopProdSales =
    CALCULATE (
        [Total Sales],
        KEEPFILTERS ( TopProdTable )
    )
VAR OtherSales =
    CALCULATE (
        [Total Sales],
        ALLSELECTED ( 'Pseudo Prod Table' )
    )
        - CALCULATE (                        -- subtracting the sales of Top 3 products
            [Total Sales],
            TopProdTable
        )
VAR CurrentProd =
    SELECTEDVALUE ( 'Pseudo Prod Table'[Product] )
RETURN
    IF (                                     -- Categorizing as Others and Top Products
        CurrentProd <> 'Others',
        TopProdSales,
        OtherSales
    )
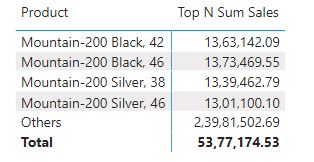
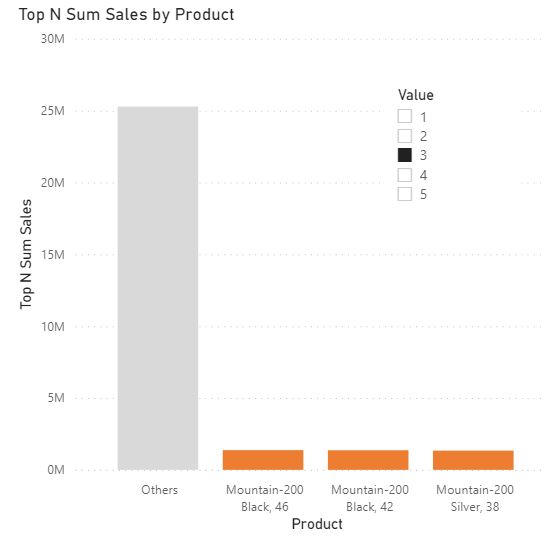
Now the Pivot shows the results of TOP 3 Products and Others
The above matrix visual when converted to a clustered column chart visual, it looks like this
As of now the number 3 to select top 3 products is hardcoded in the measure, to make it dynamic we need a slicer and link the slicer selection to our measure.
#3 Slicer to Select the Top Products
Let's create a New Table Top N Selection
TopN Selection =
{1,2,3,4,5}
- Now create a slicer on the value column of this table.
- To capture the value selected in the slicer, I will finally revise my measure like this.
Top N Sum Sales =
VAR TopNSelected =                              -- capturing top value selected in the slicer
    SELECTEDVALUE ( 'TopN Selection'[Value] )
VAR TopProdTable =
    TOPN (
        TopNSelected,
        ALLSELECTED ( 'Pseudo Prod Table' ),
        [Total Sales]
    )
VAR TopProdSales =
    CALCULATE (
        [Total Sales],
        KEEPFILTERS ( TopProdTable )
    )
VAR OtherSales =
    CALCULATE (
        [Total Sales],
        ALLSELECTED ( 'Pseudo Prod Table' )
    )
        - CALCULATE (
            [Total Sales],
            TopProdTable
        )
VAR CurrentProd =
    SELECTEDVALUE ( 'Pseudo Prod Table'[Product] )
RETURN
    IF (
        CurrentProd <> 'Others',
        TopProdSales,
        OtherSales
    )
Here’s how it would look like
#4 Conditional Formatting – For Top N and Others
I also want to color Top N products as orange and Others as grey. To do this we create a simple measure.
Color =
SWITCH (
    SELECTEDVALUE ( 'Pseudo Prod Table'[Product] ),    -- current product
    'Others', '#D9D9D9',                               -- if 'Others', then grey (hexcode)
    '#ED7D31'                                          -- else Orange (hexcode)
)
To apply this measure, go to >> format pane >> data color >> use the “fx” to select conditional formatting >> finally use format by field option on this measure.
Let’s solve the next problem and sort the bars, Top Products should appear first and “Others” in the end.
#5 Ranking and Sorting the Top Products in order of Sales
Consider this measure
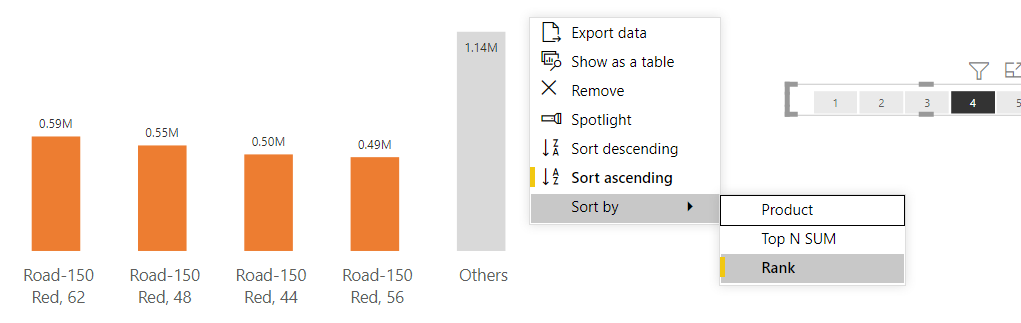
Rank =
IF (
    [Top N SUM]
        <> BLANK (),
    RANKX (
        TOPN (
            SELECTEDVALUE ( 'TopN Selection'[Value] ),
            ALLSELECTED ( 'Pseudo Prod Table' ),
            [Total Sales]
        ),
        [Total Sales],
        ,
        DESC,
        DENSE
    )
)
Now, drag this measure into the Tooltips of the visual and sort it by ascending order of rank.
#6 Create a Dynamic Title
We now need to make the title dynamic that displays the percentage contribution of Top Products. Let's create this measure.
Title =
VAR TopProd =
    CALCULATE (
        [Total Sales],
        TOPN (
            SELECTEDVALUE ( 'TopN Selection'[Value] ),
            ALLSELECTED ( 'Pseudo Prod Table'[Product] ),
            [Total Sales]
        )
    )
VAR TopProdPct =
    DIVIDE (
        TopProd,
        [Total Sales]
    )
RETURN
    'Top '
        & SELECTEDVALUE ( 'TopN Selection'[Value] ) & ' Products made '
        & FORMAT (
            TopProdPct,
            '#.#% Sales'
        )
Add this title to a Text box and format it in a large font size. and the final output looks like this.
More on DAX:
- Use Measures in Columns of a Matrix Visual
- Switch between Current Period and YTD Calculation
- Change Measures Using a Slicer in Power BI
- Slab / Tiered Calculations using DAX