The DAX TOPN function is quite useful to extract the top or bottom rows by a certain criteria. In this post, I'll talk about the nitty gritties of TOPN.
TOPN Function in DAX
DAX TOPN function returns a table with the top N number of rows based on certain criteria.
TOPN Syntax
= TOPN (
    <n value>,
    <Table>,
    [Order by Expression],
    [Order]
)
The first two parts of the function, N Value and Table Name are the compulsory inputs.
- N Value – Number of rows to be extracted. It needs to be a number.
- Table – The table from which the rows are extracted. This table can be a physical table (that exists in the data model) or a virtual table (created on the fly).
The other two parts, are optional. We shall explore them later.
TOPN Function Example 1
I have the following data model where the Sales table is related to the Calendar Table.
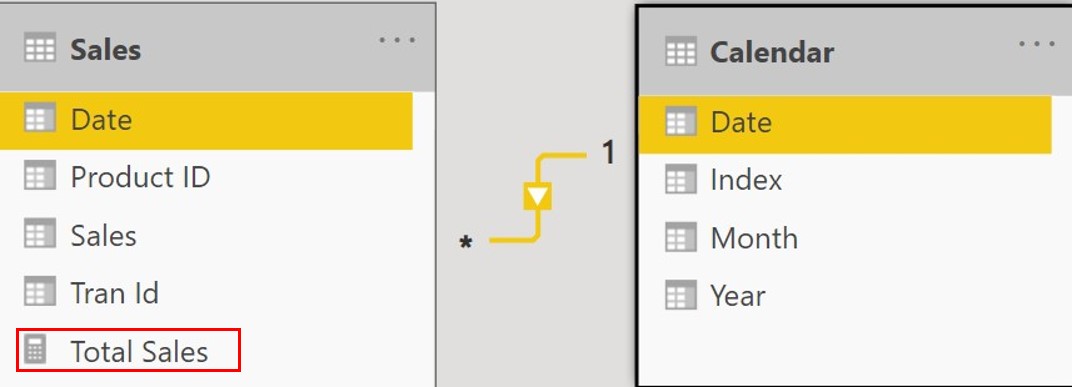
Additionally I also have a Total Sales Measure.
Total Sales = SUM(Sales[Sales])
Since, the TOPN function creates a table, let’s create one by going to Modelling tab >> New Table.
Consider this use of TOPN to extract the first row of the Sales table.
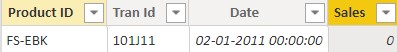
Top Table =
TOPN (
    1,
    'Sales',
)
Committing to this formula, I will get the literal first row of the Sales table. This is because in the TOPN function I didn’t specify criteria of extraction.
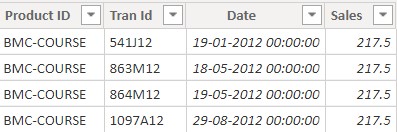
But, what if I want to extract the top row based on Total Sales measure. I can now input the third input, i.e., Total Sales, which is an optional criteria.
Top Table =
TOPN (             -- will extract top 1 row from Sales table based on Total Sales
    1,
    'Sales',
    [Total Sales]
)
Since, there were 4 rows (transactions) that tied up for the 1st position, I get 4 rows of output. Sweet!
TOPN Function Example 2
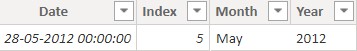
I now want to extract the date having the highest sales. The function remains the same but instead of the Sales Table I can input Calendar Table to get the date having the highest sales.
Modify the table code.
Top Table =
TOPN (             -- will extract top 1 row from Calendar table based on Total Sales
    1,
    'Calendar',
    [Total Sales]
)
Committing to the formula, I will get the the top date (and other columns) which had the highest Total Sales value.
TOPN function with a Virtual table
The second input of TOPN i.e. a table can also be a virtual table (table that doesn’t physically exist in the data model but is created on the fly)
Consider this example (created as a table)
Top Table =
TOPN (
    1,
    VALUES ( Sales[Product ID] ),  -- virtual table with unique product IDs
    [Total Sales]
)
Committing to this formula will return the best selling Product ID
![]()
Using TOPN function in a Measure
Remember that the TOPN Function returns a table and it can’t be directly used in a measure unless you have an aggregator around it.
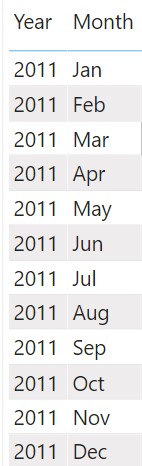
Consider this Year and Month matrix visual. I want to display the best selling day for each month.
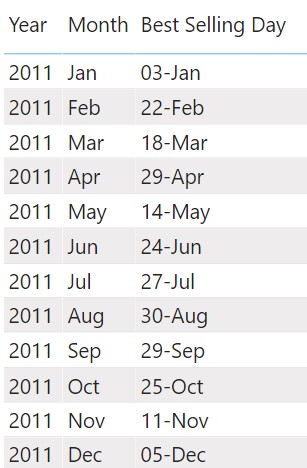
I can create the following measure to do so.
Best Selling Day =
CONCATENATEX (                             -- CONCATENATEX, concatenates the Date from TOPN Table.
    TOPN (                                 -- TOPN returns 1 top selling row from Calendar Table
       1,
        'Calendar',
        [Total Sales]
    ),
    FORMAT ( 'Calendar'[Date],'dd-mmm' )   -- some formatting applied to the output
)
Since, the TOPN function generates a table, an aggregator function, CONCATENATEX needs to be used to concatenate the table values. This measure delivers the best selling date for each month.
TOPN Recap and Summary
- The TOPN function accepts and returns a table.
- The Input table can either be a physical or a virtual table.
- Since the TOPN function returns a table, while using it in a measure, it needs to be wrapped in any aggregator function that can display a single value instead of table.