Once in a while you’ll run into calculating weighted average in Power BI compared to the regular average.
The difference is that in average all the values are equally important while in weighted average each value is assigned a specific weight and its relative importance is decided by its weight. Clearly for weighted average calculation we would require two things.
- Weight of the value
- The value itself
Let’s run through 2 scenarios – Monthly Weighted Average of Sales and Product Weighted Average of Sales.
Weighted Average in Power BI – Video
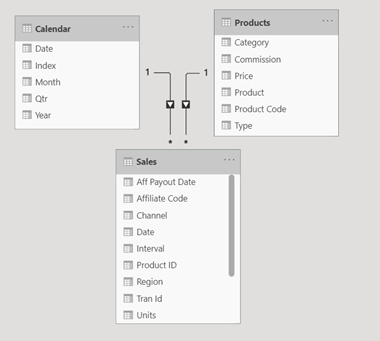
Consider this Data Model
and this Pivot Table – Total Sales Across Months and Years
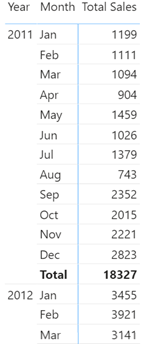
Question – Find the Monthly Weighted Average Sales.
Calculating Monthly Weighted Average Sales
For Monthly WA I need 2 numbers
- Monthly Weight = which is Monthly Sales / Annual Sales
- Value = Monthly Sales
Consider 2 Interim DAX Measure
AnnualSales =
CALCULATE(
[Total Sales],
ALL('Calendar'[Month],'Calendar'[Index])
)
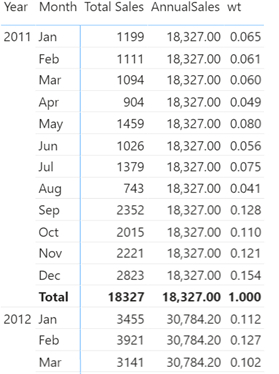
wt = DIVIDE([Total Sales], [AnnualSales])
And this Pivot Table
Let’s build the logic further
- Although multiplying Wt and Annual Sales will return the correct value to aggregate
- But at the total level we’ll run into problem since 18,327 will be multiple with 1 and return the same number.
- At the Year Total Level – What I need is to create the same pivot table which I can see (with Year Month Sales and Wt columns)
- Iterate over each row and multiply Annual Sales x Wt
- And then sum it up
- That would be the correct number for the Year Total
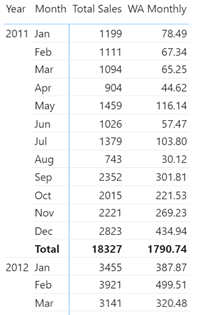
Yup.. I get it, if that made you roll your eyes! Go on for a bit and the results will make sense. Consider this measure
WA Monthly =
VAR AnnualSales =
    CALCULATE(
        [Total Sales],
        ALL('Calendar'[Month],'Calendar'[Index])
    )
VAR MonthlyTable =
    ADDCOLUMNS(
        SUMMARIZE(
            Sales,
            'Calendar'[Year],'Calendar'[Month]
        ),
        'MonthlySales', [Total Sales],
        'Wt', [Total Sales]/AnnualSales
    )
RETURN
    SUMX(
        MonthlyTable,
        [Wt] * [MonthlySales]
    )
See these results..
Weighted Average by Product
Consider another example of Product Weighted Average Sales. I have this simple pivot table with Year, Product and Total Sales.
. 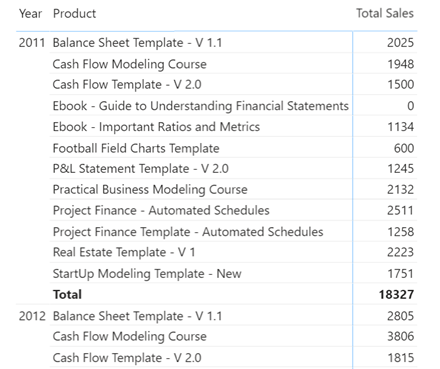
The requirement is to find out Product Weighted Average Sales.
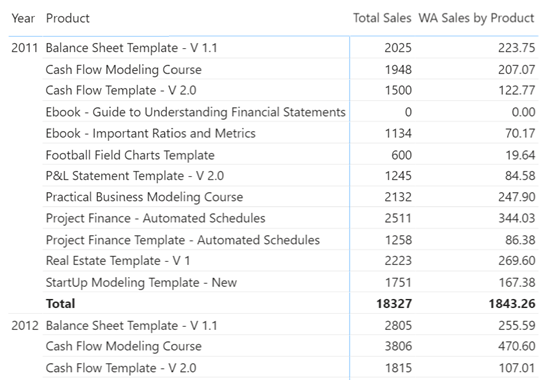
The logic remains the same, with a slight change in weight calculation = Product Sales / Yearly Sales for All Products. And subsequently the measure changes slightly.
WA Sales by Product =
VAR AnnualSales =
    CALCULATE(
        [Total Sales],
        ALL(Products[Product Code],Products[Product])
    )
VAR SummarisedTable =
    ADDCOLUMNS(
        SUMMARIZE(
            Sales,
            Products[Product],'Calendar'[Year]
        ),
        'SalesWt', [Total Sales] / AnnualSales,
        'MonthlySales', [Total Sales]
    )
RETURN
    SUMX(
        SummarisedTable,
        [SalesWt] * [MonthlySales]
    )
And the sweet weighted results!
More DAX Calculations in Power BI
- Present your Data in Fiscal Year
- Running Total for Dates and Non Dates Values
- Calculate Percentiles in Power BI
- Slab / Tiered Calculations in Power BI
- Top Product Analysis